

The 2025 Verizon Data Breach Investigations Report (Report)
Because the only thing better than beautifully-written analysis is a less-resourced person performing analysis on that analysis

Summer has descended upon us here in the United States and the flowers are welcoming the season in full bloom. Unless, of course, said flowers have the unfortunate privilege of being under my personal care, where—it pains me to say—many plants have fallen victim to my lack of care.
Regardless, I noticed the other day how some of my flowers that are somehow still alive have bloomed recently are blooming later than others. These flowers are no less beautiful than the flowers that blossomed earlier in the season, they are, you know, just fashionably late to the party.
Some people, like our fauna friends, are anticipatory and able to glide into the currents of the time at their peak. Does this make the late bloomers any less meaningful? No, not at all. In fact, late bloomers often bloom after many other blossoms have faded. It’s as if different kinds of plants are in an ecological tag team match, trading places to maximize effectiveness from those precious rays of sun.
And so, just like how some flowers bloom late in the season yet still thrive, and just like how my voice didn’t drop until sophomore year and yet I somehow survived high school, I present you with writings that come after the cool kids have already done the same.
Together we will walk through the Verizon Data Breach Investigations Report to explore the findings uncovered within. I’ll also share some opinions of my own because, well, this is a blog and what good would a blog be without opinions? I didn’t just scan headings in an attempt to point out the obvious, I sat down to look for specifics in the report that jumped out to me, hoping to find points to elaborate on and discuss.
The goal was to organize my notes into something useful that could help guide someone else’s understanding of the full report. An analysis of the analysis, a study of the study, an investigation into the investigation, an examination of the actual examination, a breakdown of the lowdown as written through the voice of a security practitioner with too much time on their hands.
I now introduce you to the Verizon 2025 Data Breach Investigations Report (Report).
This one’s for you, fellow late bloomers.
The Verizon 2025 Data Breach Investigations Report (Report)
Like the annuals freshly planted each year, Verizon gifts the cybersecurity community with an annual, crisp, ever-so-creatively designed report called the Data Breach Investigations Report (DBIR—I’ll refer to it as “DBIR” from here on out). And, in a world that grows more and more concerned with cybersecurity, this report provides security practitioners and leaders with valuable insight into real-world incidents. Data driven, statistical information is critical for security leaders as they communicate with business leaders, boards, and communities.
These insights aren’t conjecture on the part of Verizon. No, not at all! They are backed up by cold, hard data supplied by a variety of cybersecurity industry partners.
First, some housekeeping
The Verizon team includes guidance on how to properly cite the data, graphs, facts and figures for those individuals who would like to cite their report (hey, they’re talking about me!). I must cite the source of this write-up as the “Verizon 2025 Data Breach Investigations Report”. It’s been a million years since I looked up how to formally cite something, so, here goes: aside from a few smidgens of outside sources, everything in this article is sourced from the Verizon 2025 Data Breach Investigations Report. I do like to define words with links to additional material and the inclusion of such resources, aside from the DBIR, will be clear.
The Verizon team also points out a few more important details when it comes to referencing the report:
They ask that people not directly distribute the report (as much as I would like to)
Go to https://verizon.com/dbir, enter your name and email, and a PDF magically appears
“Exact quotes are permitted, but paraphrasing requires review.”
I will include quotes and aim to make it clear when I’m offering my own information as additional color to the Verizon data
I’ll put on my best-fitting journalist pants here and make sure to do this properly
No, I don’t actually know what “journalist pants” are. Are those made by JNCO Jeans1?
Verizon, please yell at me as appropriate.
Figures and graphs are free to use, as long as they’re presented as they are in the report.
Basically, anyone can use the DBIR as a source as long as proper citation is provided, as requested, and that the materials found in the report are not altered in anyway. This is why they ask to review any paraphrasing, aiming to preserve the integrity of the report itself.
Do yourself a favor - stop, take a second, then download the full report! My poor man’s prose may have already turned you away, but I promise that the original report is well worth your time. If you do keep reading (hugs to you), you can look the information up yourself as we move along.
Alright, enough housekeeping. Let’s get this party going!
A picture is worth a thousand words
Does anyone know who actually said that line? I sure can’t find anything.2
Anyway…
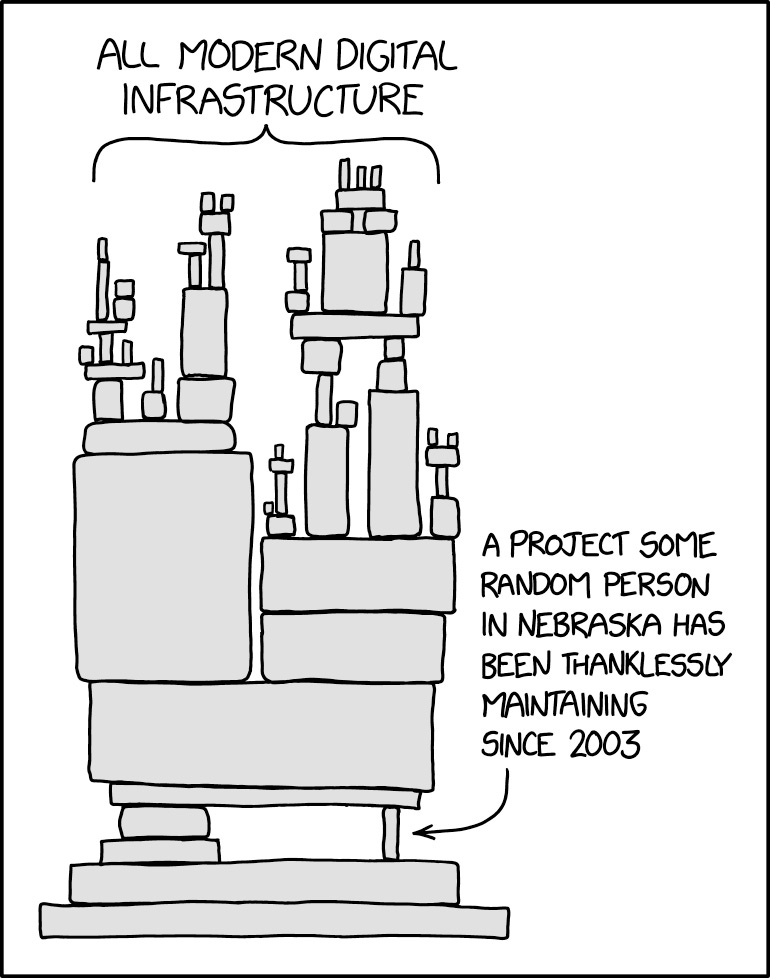
In August 2020, Randall Munroe hit the nail on the head with his comic, “Dependency”, published on his marvelously simplistic website, XKCD.com. “Dependency” is a funny comic, sure, especially if you’re at all familiar with what open source software is and how the for-profit software sector relies on way too much on freely available software packages.
Where Munroe hits the bullseye dead in the center is in depicting the size of an individual piece of open source software in proportion to the rest of the software product that relies on it. The first half of the joke is that all of the digital realm is overly reliant on a tiny piece of software outside of their control, with the second part of the joke being that some hapless Midwesterner is keeping that code up to date with no recompense at all from companies profiting off of their work (oh god, did I just explain a joke… yikes, sorry about that).
The comic above can be used to tell the story of other critical dependencies in tech, too. That’s where the artwork for the Verizon 2025 DBIR comes in.
No, the cover art for this blog post isn’t the original art (you’re just all the unlucky victims of an affordable subscription to Canva and the fact that I do not have a social life).
Look at the actual DBIR cover and see if you can spot any similarities between Munroe’s “Dependency” comic and what the artists chose to illustrate:
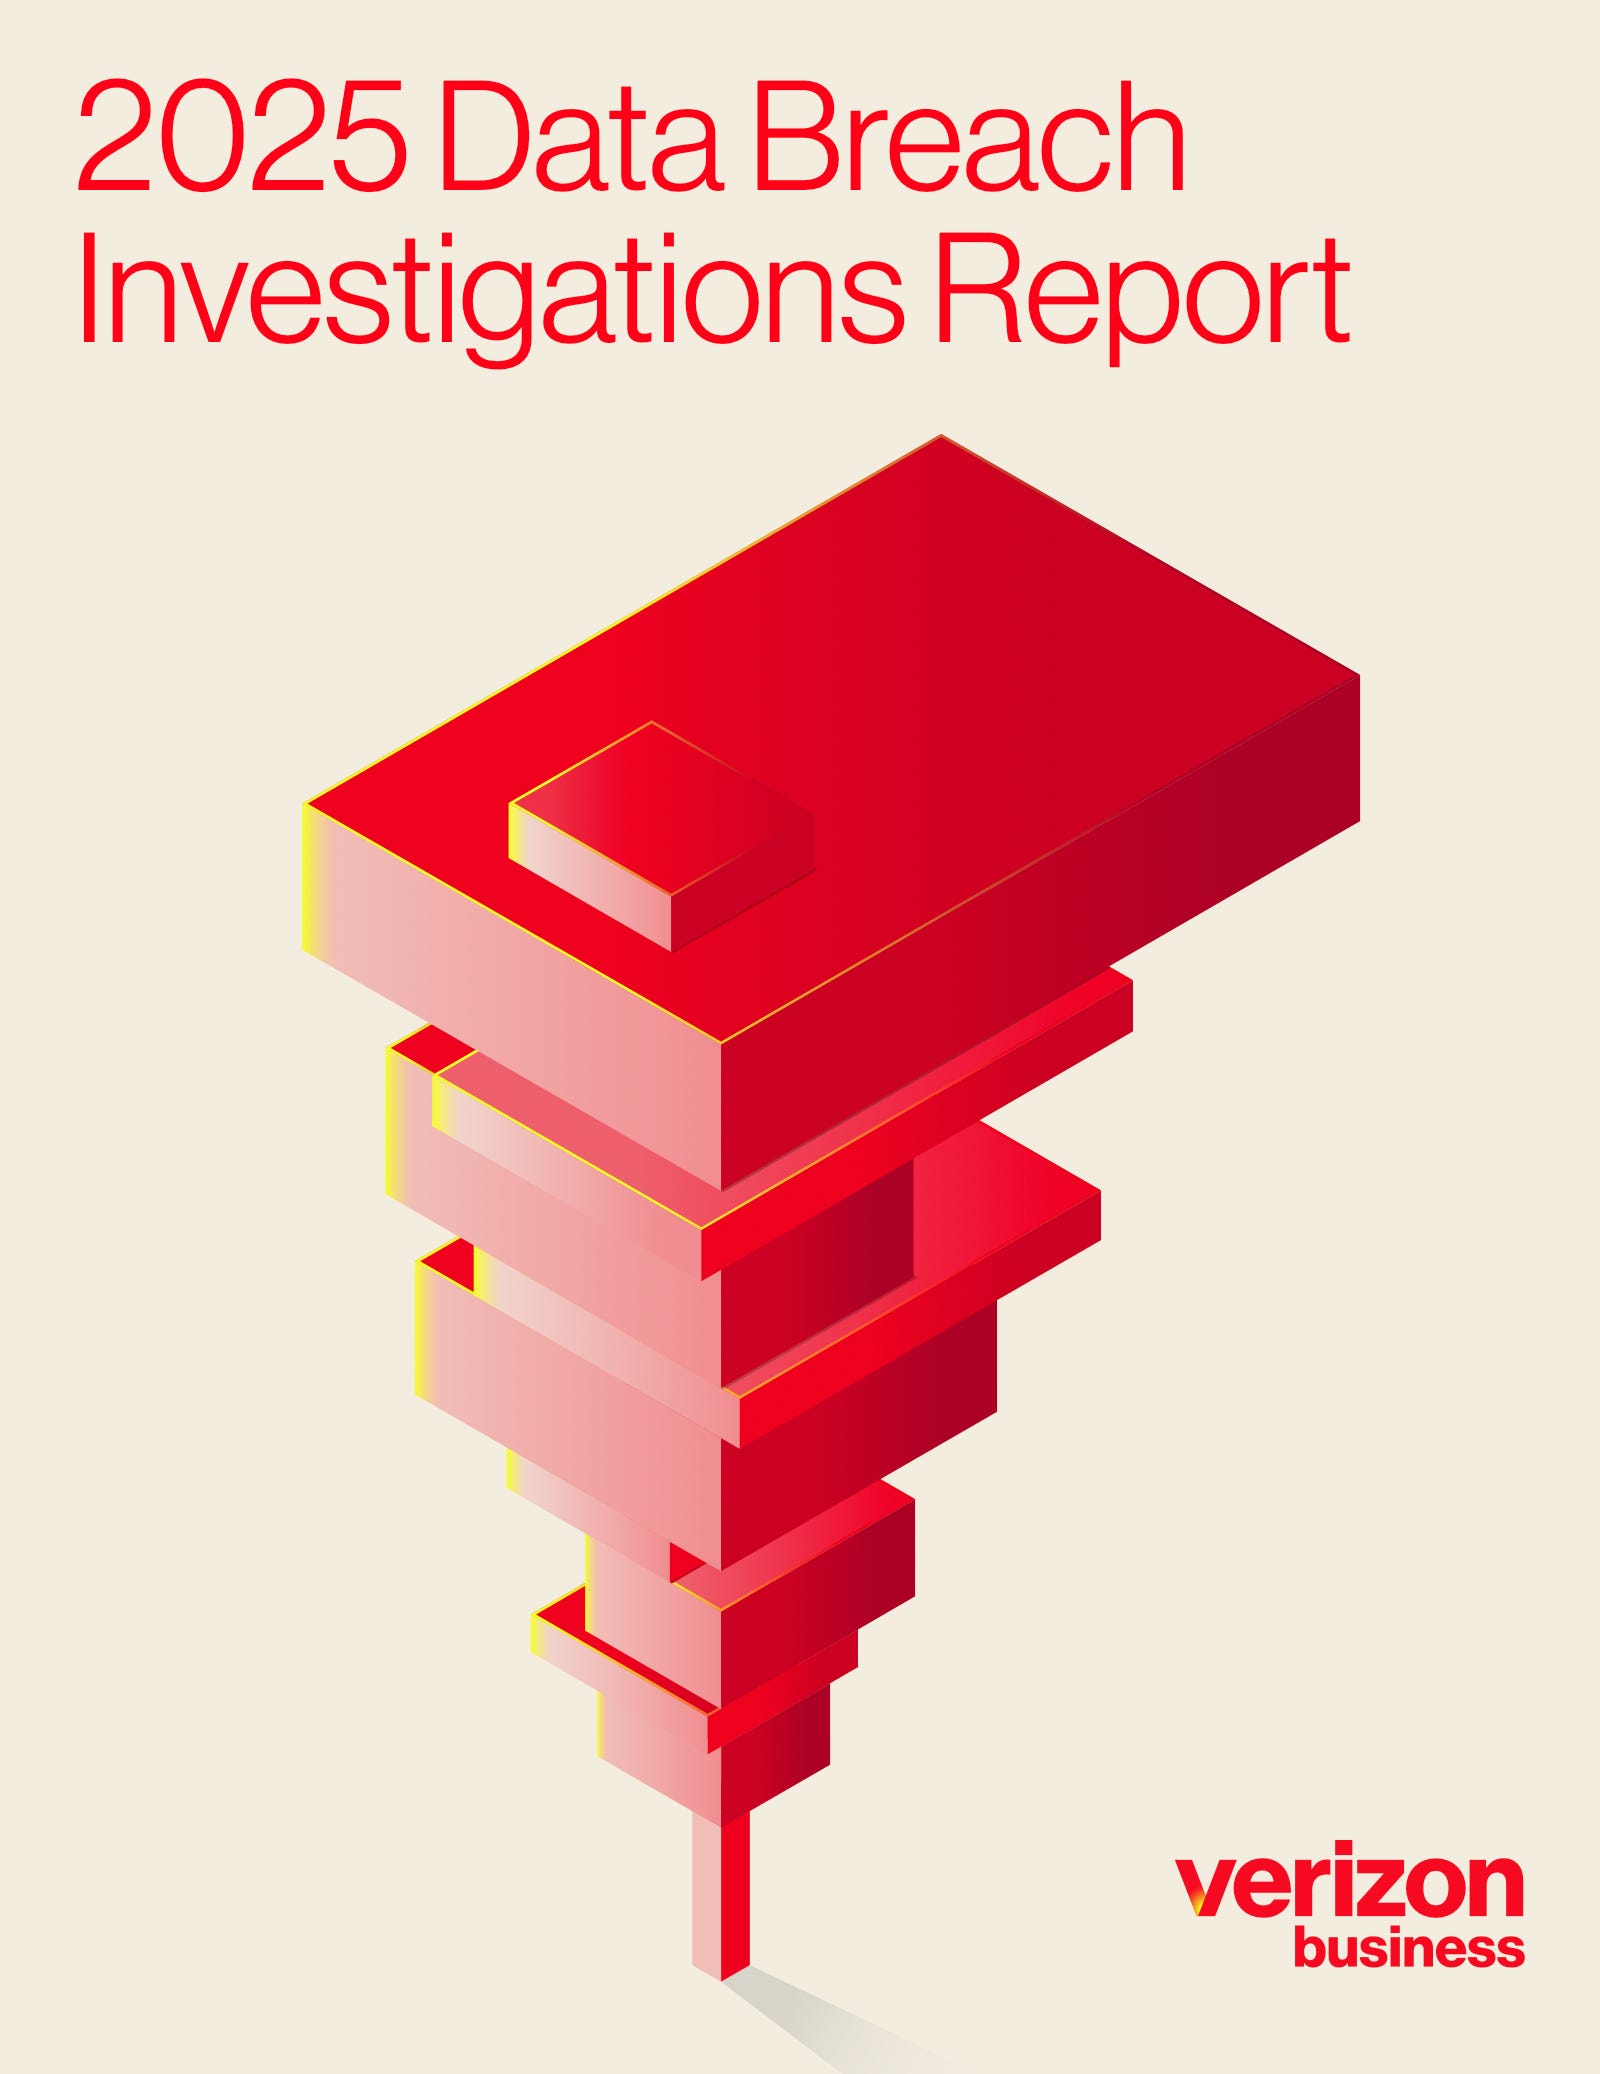
It’s pretty darn similar, right?
Though, rather than software dependencies alone, that red, towery-thing was designed as a depiction of heavy third-party involvement as “ever-present” across breaches in 2024.
According to the authors, the Verizon DBIR design team “rose to the challenge of representing the balancing act an organization’s security programs have to perform with the growing dependence on those third parties.” And
“If the impossibly balanced shape on the cover makes you uncomfortable, you have begun to understand the challenges modern Chief Information Security Officers (CISOs) face in the current environment.”
That shout of “Amen!” you may have heard was voice of every security leader from here to Timbuktu cheering in unison.3
If you’re in security, name me one security program that doesn’t rely on:
Third-party tooling
Open source software (maintained outside of the organization)
Third-party intelligence
Third-party software to business and/or product operations
Thoughts, prayers, and creative incantations, hoping that your organization isn’t the next target of some threat group’s ire
Okay, so I’m kidding with that last one (sort of), but could you think of anything? I sure couldn’t. That’s because the reality is, whether by the natural state of things or by us all becoming victims of genius marketing tactics, that third-party tools make the security world go ‘round. Even if such tools aren’t owned by security, third-party tools are deployed across every business.
Each and every third-party connection or integration represents an extension of the attack surface for a given organization. That’s just how the world works nowadays.
I applaud the design choices this year, but I do think that the Verizon DBIR team missed the mark in giving kudos to Randall Munroe.
Howdy, pard’ner!
One major thing that sets the DBIR apart from other reports in the security industry is the reliance on data sources from other reputable organizations aside from that of the publishing organization. Other companies do publish wonderful work, yet their work is usually catered towards their ideal customer profile and/or limited to only the data they have through their company or their product. While, yes, Verizon’s own data is included in the report, the DBIR relies heavily on outside contributors to provide information.
These datasets come from around the world, spanning several governmental agencies (United States Secret Service, CERT-EU, National Cybersecurity Agency-Thailand) and a breadth of tech companies, including many recognizable names with massive global footprints (Okta, Zscaler, Akamai, Tenable, Qualys). This diversity of inputs allow Verizon to have an extremely rich set of data, providing for a unique glimpse into security attack trends around the world.
A few general thoughts
Before we dive into the waters that Verizon made warm for us, I wanted to share a few overall impressions of the DBIR as a whole.
Personality, style, and overall fabulousness

I LOVE the personality sprinkled throughout this report. The primary focus is on objective analytical insights, yes, yet the DBIR team finds room to pepper their personalities here, there, and everywhere while still giving us the statistics we crave. I love it. The incorporation of a more approachable writing style makes the report fun to read while still painting the picture of what the data was describing over the past year. Many of the headings are clever and the bulk of the paragraphs are a mixture of direct, objective writing and witty banter amongst nerdy colleagues.
There’s also clarity of tone across the document. I’m not sure if the DBIR team are all trained writers, or if their work was edited to be as clear as possible, but there’s no mistaking when the team is giving us a chuckle versus when they are telling us something serious. I took this writing style as a major learning moment and something I’d love to emulate as I keep writing my own things.
Footloose footnotes
Footnotes are either something to be avoided or something to be looked at without actually reading—but, let’s face it, you saw the footnote and just had to take a glance, only to lose your place in the text, then you realize that you may not have been paying attention to what you’re reading for the past 5 pages or so (ADHD, anyone?).
I typically look forward to reading footnotes with about as much zeal as I give towards a 30-foot long Walgreens receipt. “Hold my beer,” says the Verizon DBIR team.4
Here’s an example of the playful footnotes they used to garnish their prose—even lacking context, the personality is plain to see:
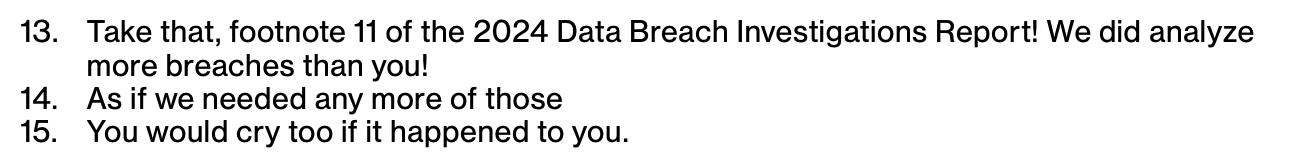
Some papers are written with the personality of a bloated whale carcass.5 The DBIR is a prime example of how you can incorporate a healthy helping of pizzazz while still saying important things effectively.6
So many charts, so little time
In past years, I’d be lying if I said that I did anything more than skim the DBIR for the cute little charts, maybe scooping up a headline or two along the way so I sound intelligent in some future conversation. The DBIR team goes out of their way to paint fashionable charts with lots of color, likely because, I’m assuming, most people are just like me and are scrolling through to see the pretty pictures. Behind every one of those “pretty pictures”, though, is troves of data and lots of analysis.
Having data alone is a great first step. Having data that is relevant and useful is a solid Step #2. Then, perhaps most important, is knowing how to relay that data to others in a way that both (1) accurately depicts the objective interpretations supported by the data itself, and (2) helps you achieve your aims.
If you want a super big, gold star for using data awesomely, then you’ll find ways to add pretty pictures into your PowerPoint slides. The Verizon DBIR gives us all a masterclass in how to do this through innovative data visualization. Watch and learn, folks!


The bummer is that not all charts are created equally well. I was looking forward for the “Industry” breakdown section, where the team breaks apart the data set in accordance with the various industry verticals. Here, they produce these gigantic charts that, while interesting, are extremely difficult to read. In the example below, which takes up a full page in the report, notice how the x-axis is only listed at the bottom of the page, meaning that you have to perform Olympic levels of eyeball ping pong in order to see which column you’re looking at.
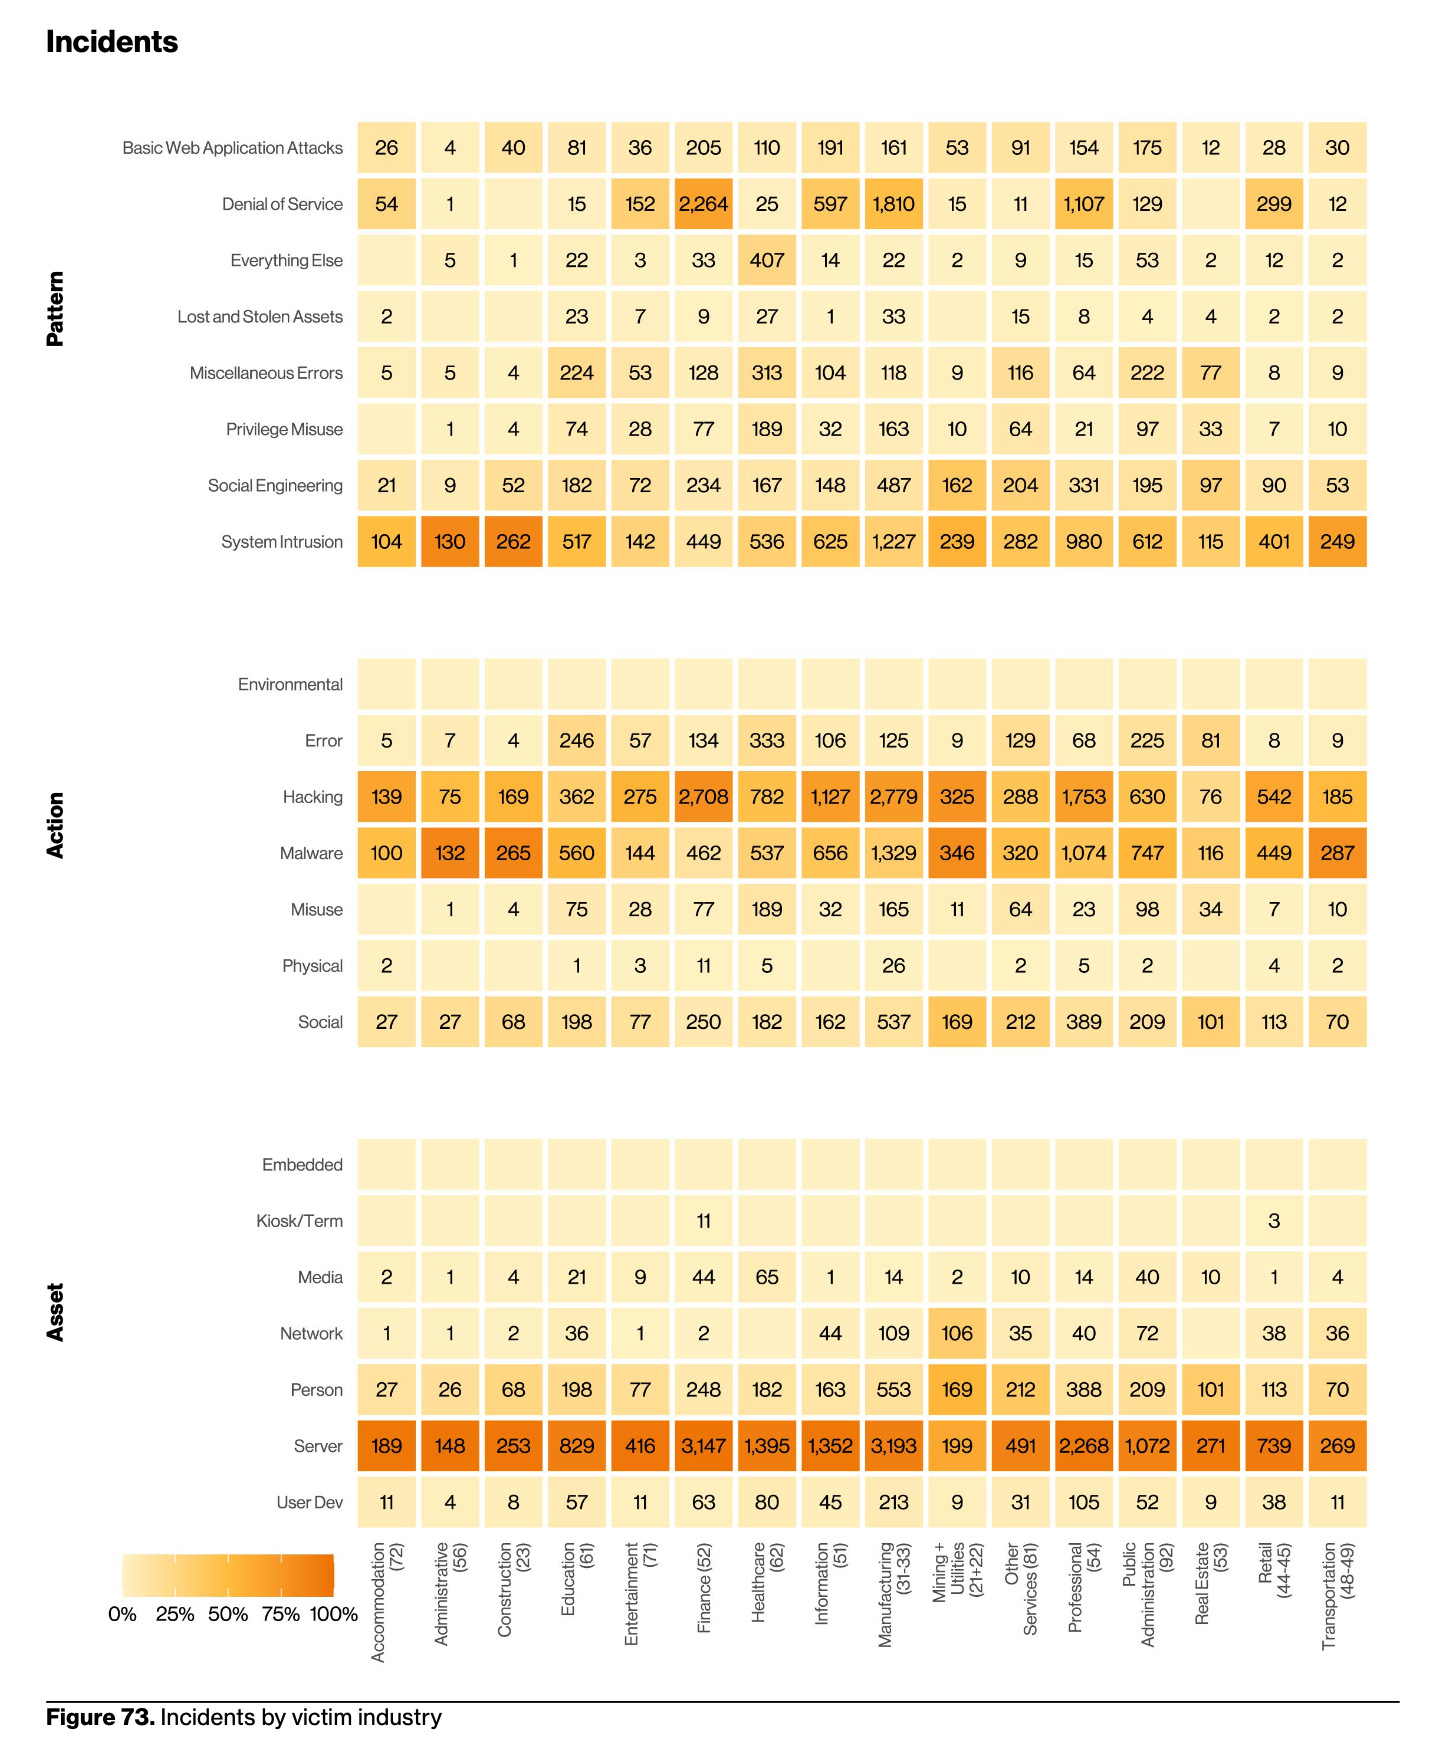
For my plebeian brain, this was disappointing. The heat mapping of totals and the level of detail is impressive, yet it’s a bit of an airball to me, like a jump shot that looks perfect as it leaves the player’s hand, even with a perfect trajectory through the air, only for the ball to just miss the rim entirely. The above is an example where perhaps too much thought produced an over-engineered chart which misses the mark.7
I do also like how they include the n=123 (or whatever number) at the bottom of each and every graph, showing the size of the dataset used for that specific measurement. This is so helpful for readers as it prevents people from having to lookup numbers elsewhere, like in footnotes, allowing them to continue moving about the cabin as they read.
Still, even through my peckishness, I thoroughly enjoyed the visuals. Even if you don’t take the time to read the whole report, do yourself a favor and take a look at the stories as told through the charts alone.
Ain’t no party like a third-party party, ‘Cause a third-party party don’t stop
An example of this report’s fabulousness is the first image in the gallery above, shared at the beginning of the report itself, presented under the headline, “It’s third party, and we’ll breach if we want to”. The team took the word “party” and then used birthday cakes in the accompanying chart because everyone knows that you can’t have a party without a cake8. Fab-u-lous.
Unfortunately, less fabulous is the heavy increase in third-party involvement in this year’s data set. The DBIR states, “we found third-party involvement of some sort in 30% of all breaches we analyzed, up from roughly 15% last year”. That means that there was some form of third-party contribution to data breaches9, not just to more incidents more broadly.
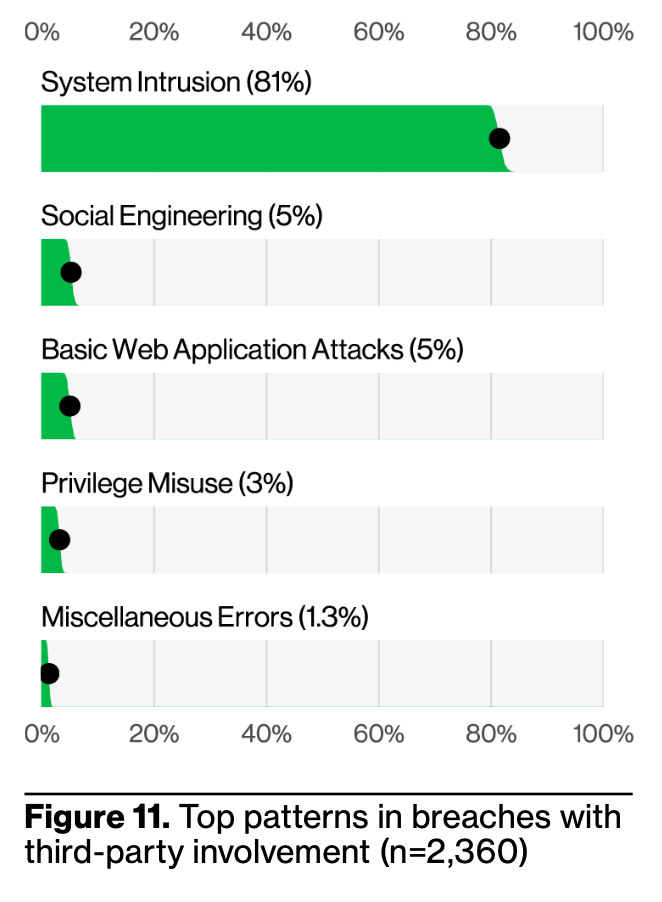
The birthday cake chart is just the first of a 1-2 combo as they then hit us with how 81% of third-party breach involvement involved vulnerability exploitation (System Intrusion). Companies of all sizes struggle with vulnerability management, so why should a company’s vendors be any different?
The difference is huge. When one company relies on another company as a vendor, particularly in B2B SaaS, there’s both contractual obligations and implicit trust. The contractual obligations part is literally what the vendor promises to deliver in a binding agreement, while the implicit trust occurs as no one is keeping tabs on all vulnerabilities for all of the vendors. The customer trusts that the vendor will do what’s needed in order to keep their house in order.
Vendor security assessments and vendor risk assessments are an impartial science at best. Even those companies with the strongest vendor security posture are susceptible to third-party events as soon as that first connection is made from between one product and another, or, as soon as they begin entering confidential data into that product.
Third-party software providers have to balance the need to expand their product and their customer base with an expanding landscape of vulnerabilities across their own third-party services and software dependencies.
If you are providing software to another company, you are responsible for identifying, tracking, prioritizing, and remediating vulnerabilities within your product. Period. As the Verizon DBIR states, “although there are a lot of mitigating controls and factors to help prevent a breach initiated by a software vulnerability from happening, the core issue—the vulnerability even existing—links back to the software vendors.”
Some of these third-party weaknesses could be easily solved through improved software development hygiene. Credential reuse is, sadly, a gray cloud that continues to hang over all companies, though it was shocking to see them say, “our research found the median time to remediate leaked secrets discovered in a GitHub repository was 94 days.”
The median time to remediate leaked secrets discovered in a GitHub repository was 94 days10
Zero-day vulnerabilities are one thing. Taking three months to pull published secrets from your repo? That’s another thing.
Want to be even more upset by that statistic they uncovered? Look at the chart of the dataset below.
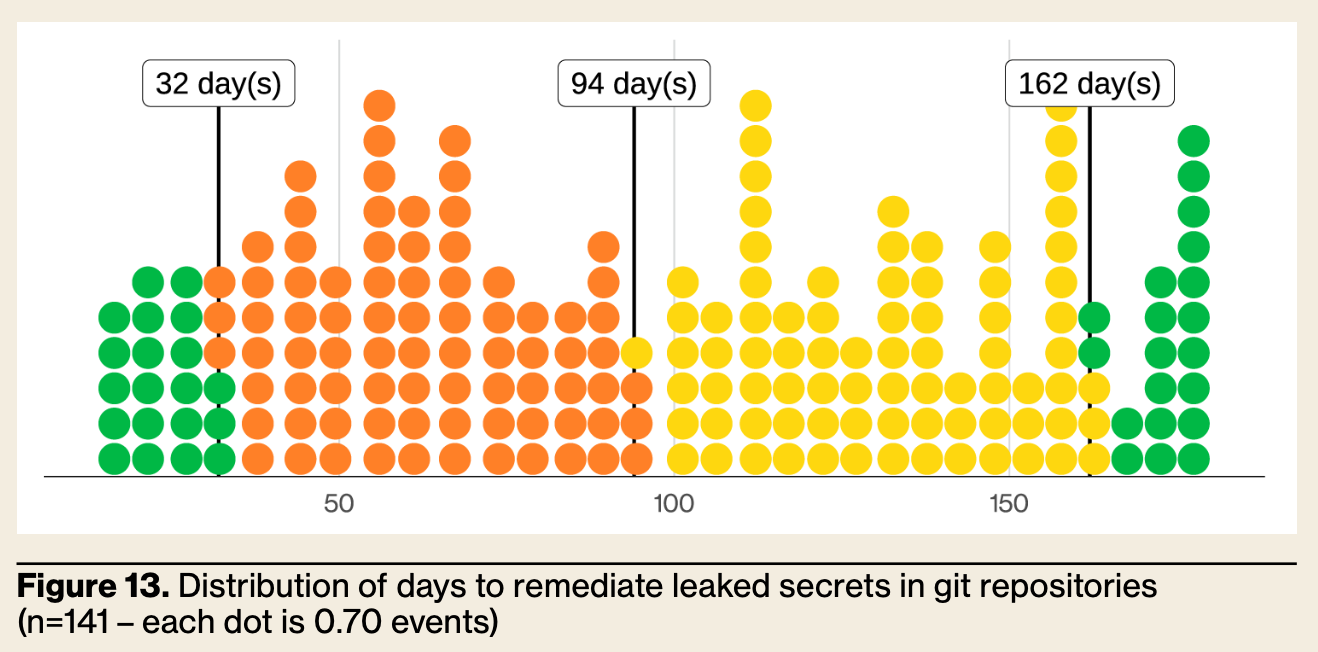
If you’re currently working as an engineer and you’re not shocked by the chart above, I don’t know what to tell you.11 I’m not sure about you, but an incident like what is shown above would be a big deal at any company that I’m familiar with and would likely be for yours, too. Third-party risks are finicky and pervasive enough without poor software development hygiene revealing preventable problems.
Third-party risk—the gift that keeps on giving!
Your information classification destination
One of the meatiest sections of the report is titled “Incident Classification Patterns”. Pages 37-6512 categorize the incident data into generalized terms that are approachable to most. I recall a time where I didn’t know what these terms meant, so I’ve included links that hopefully help introduce the category to someone new to the field:
Miscellaneous Errors (falls under insider threat13)
I like Crowdstrike’s use of “Negligent insider threat” for this one
Privilege Misuse (intentional insider threat)
Includes ransomware and malicious software/malware
Everything Else14
This is a very small percentage of classified activity
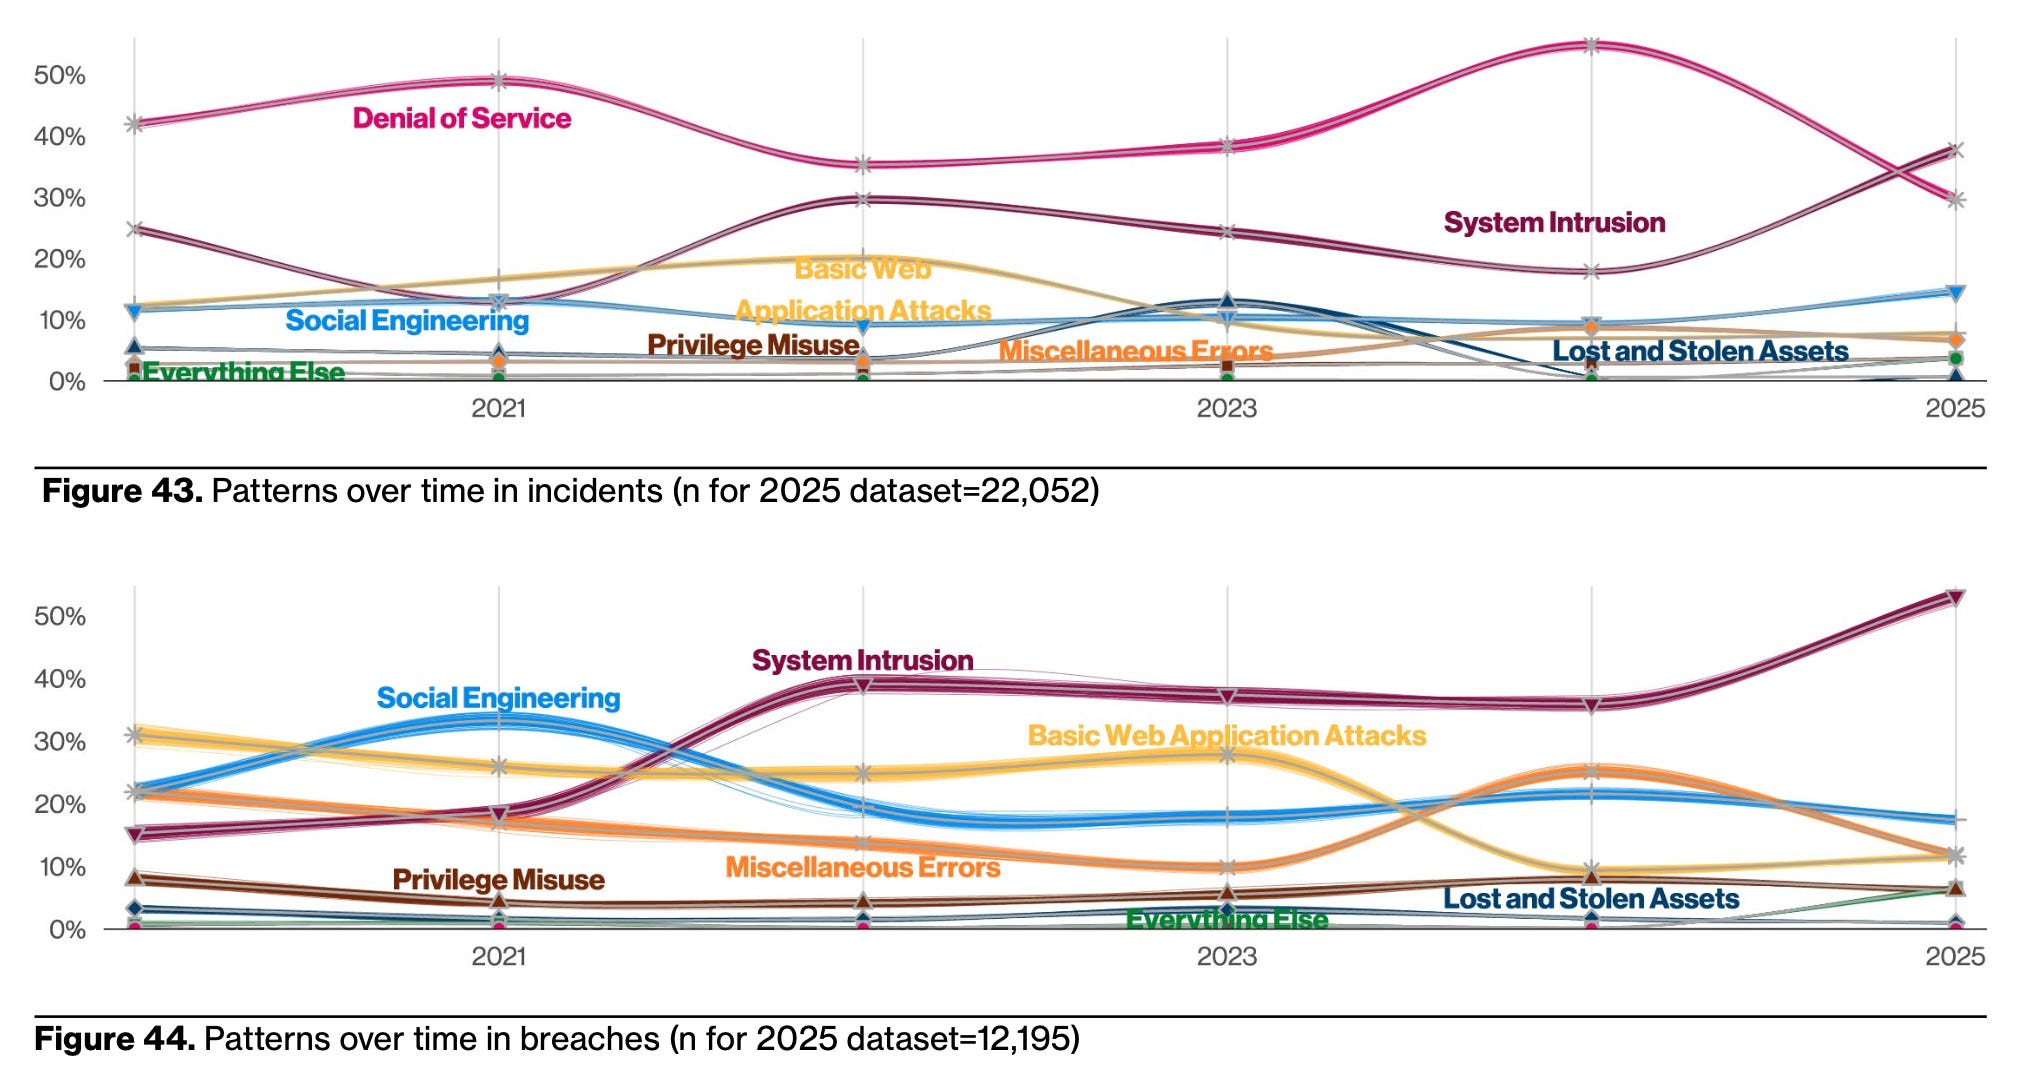
“These incident patterns serve to cluster the similar incidents into categories that make them easier to understand and recall,” they say, and I agree. I think this categorization is helpful to readers.
Check out this chart where they depict all of the different categories, separating incidents from breaches, showing us which types of activity occur for each. Super cool.
Need a guide? This report shall provide
Well, not this report. Not mine, but the cool Verizon one. You know what I mean.
The caboose attached to the end of each category is recommendations from the Center for Internet Security (CIS). CIS flexes their technological muscle to create and share free resources like the CIS Controls and CIS Benchmarks, made available to all and references by most security tooling.
Here, the team lists CIS Controls that may help detection, mitigation, and/or remediation activities for that given genre of attack type. What a blessing! If a particular category catches the eye of the reader, then, poof! There are easily referenceable materials to help improve your company’s security posture in that area.
The inclusion of freely available, meaningful control suggestions makes this report immediately actionable.
You may look at the control listings in the report and think that some are pretty simple, if not obvious. Though, I have trouble recalling a time when the small things weren’t included in a breach report or root cause analysis. Often the obvious controls are the very routes that provide an inlet for initial access or a slew of other actions.
System intrusion
For “system intrusion”, they explain how it’s an intentionally broad category, saying, “System Intrusion encapsulates all the breaches and incidents that leverage a diversity of techniques, predominately hacking techniques and malware, with a dash of Social Engineering. Think of this pattern as the ‘hands on keyboard’ type of attackers, in which they’re using a combination of automation and craft to breach organizations’ defenses and compromise their environment, largely with the purpose of deploying Ransomware, which accounts for 75% of breaches in this pattern.”15
They make a point to highlight ransomware payments, which is particularly interesting given the addition of cyber insurance data into the dataset this year. Decreasing from last year, the “median ransom paid comes up as $115,000.” It’s funny how they choose the phrase “comes up” to showcase a metric that has objectively gone down, but who am I to judge?
The team takes care to mention Magecart in this section, which is a piece of malware that vacuums up sensitive information, namely credit card information, from victim e-commerce sites. “They represent 1% of System Intrusion breaches and 80% of breaches involving payment cards.”
Wow. I’ll be honest, so much of my security life has revolved around attack vectors at the enterprise level that I often forget how prevalent cyber attacks are at the consumer level. The compromise of a single payment card for a single person carries the potential for devastating consequences, especially in the United States. Effective software like Magecart only makes easy targets even easier to victimize.
Guidance from the U.S. Consumer Financial Protection Bureau, “What do I do if I’ve been a victim of identity theft?”
Trust, you must, even if I am sus
-piciously, potentially, just maybe-ly not who I say I am.16
Social engineering gains prominence as the second category brought into the spotlight of the DBIR. And for good reason, as 85% of the 4,009 incidents17 involving some form of social engineering resulted in a data breach. Think about an 85% success rate in any sport in the world: a batting average of .850, kicking the ball into the sports net 85% of the time, making 85% of your three-pointers in basketball, heck, even 85% of your free throws would be a huge deal. That’s an incredible statistic.
Stalwarts like phishing and pretexting take the cake, still (remember how we talked about the small, little things?). Criminals leverage these methods because they are incredibly effective.
Why would I spend my blood, sweat, and tears trying to gain entry from a technical standpoint when I can just give you quick call, send you phishing email, or hit you up on LinkedIn pretending to be someone I’m not?
For social engineering, I love Rachel Tobac’s work, insight, and approach in teaching others. Here’s an interesting Q&A that she did with HackerOne, with a million other bits of content involving her work elsewhere online. She’s great and you should follow and support her! Check out her company, SocialProof Security. We need more empathic security professionals like Rachel on this Earth.
Have you ever found yourself analyzing a report, then writing a report on that report you were analyzing, only to see that your report on the report is almost as long as the report itself? Well, that’s me. Right now. In this moment. Thank you for bearing with me thus far!
Different attack patterns for different industries
The second-meatiest section of the Verizon DBIR is that entitled “Industries”. Using the North American Industry Classification System (NAICS), something I didn’t know existed until reading this18, the team separates the data into applicable chunks within each industry. They unpack a lot of information that I will not regurgitate here (fortunately for us all), so it’s worth a glance.
I found the introductory table fascinating in and of itself. You can see the separation of “incident” versus “breach”, business size, plus industry category.
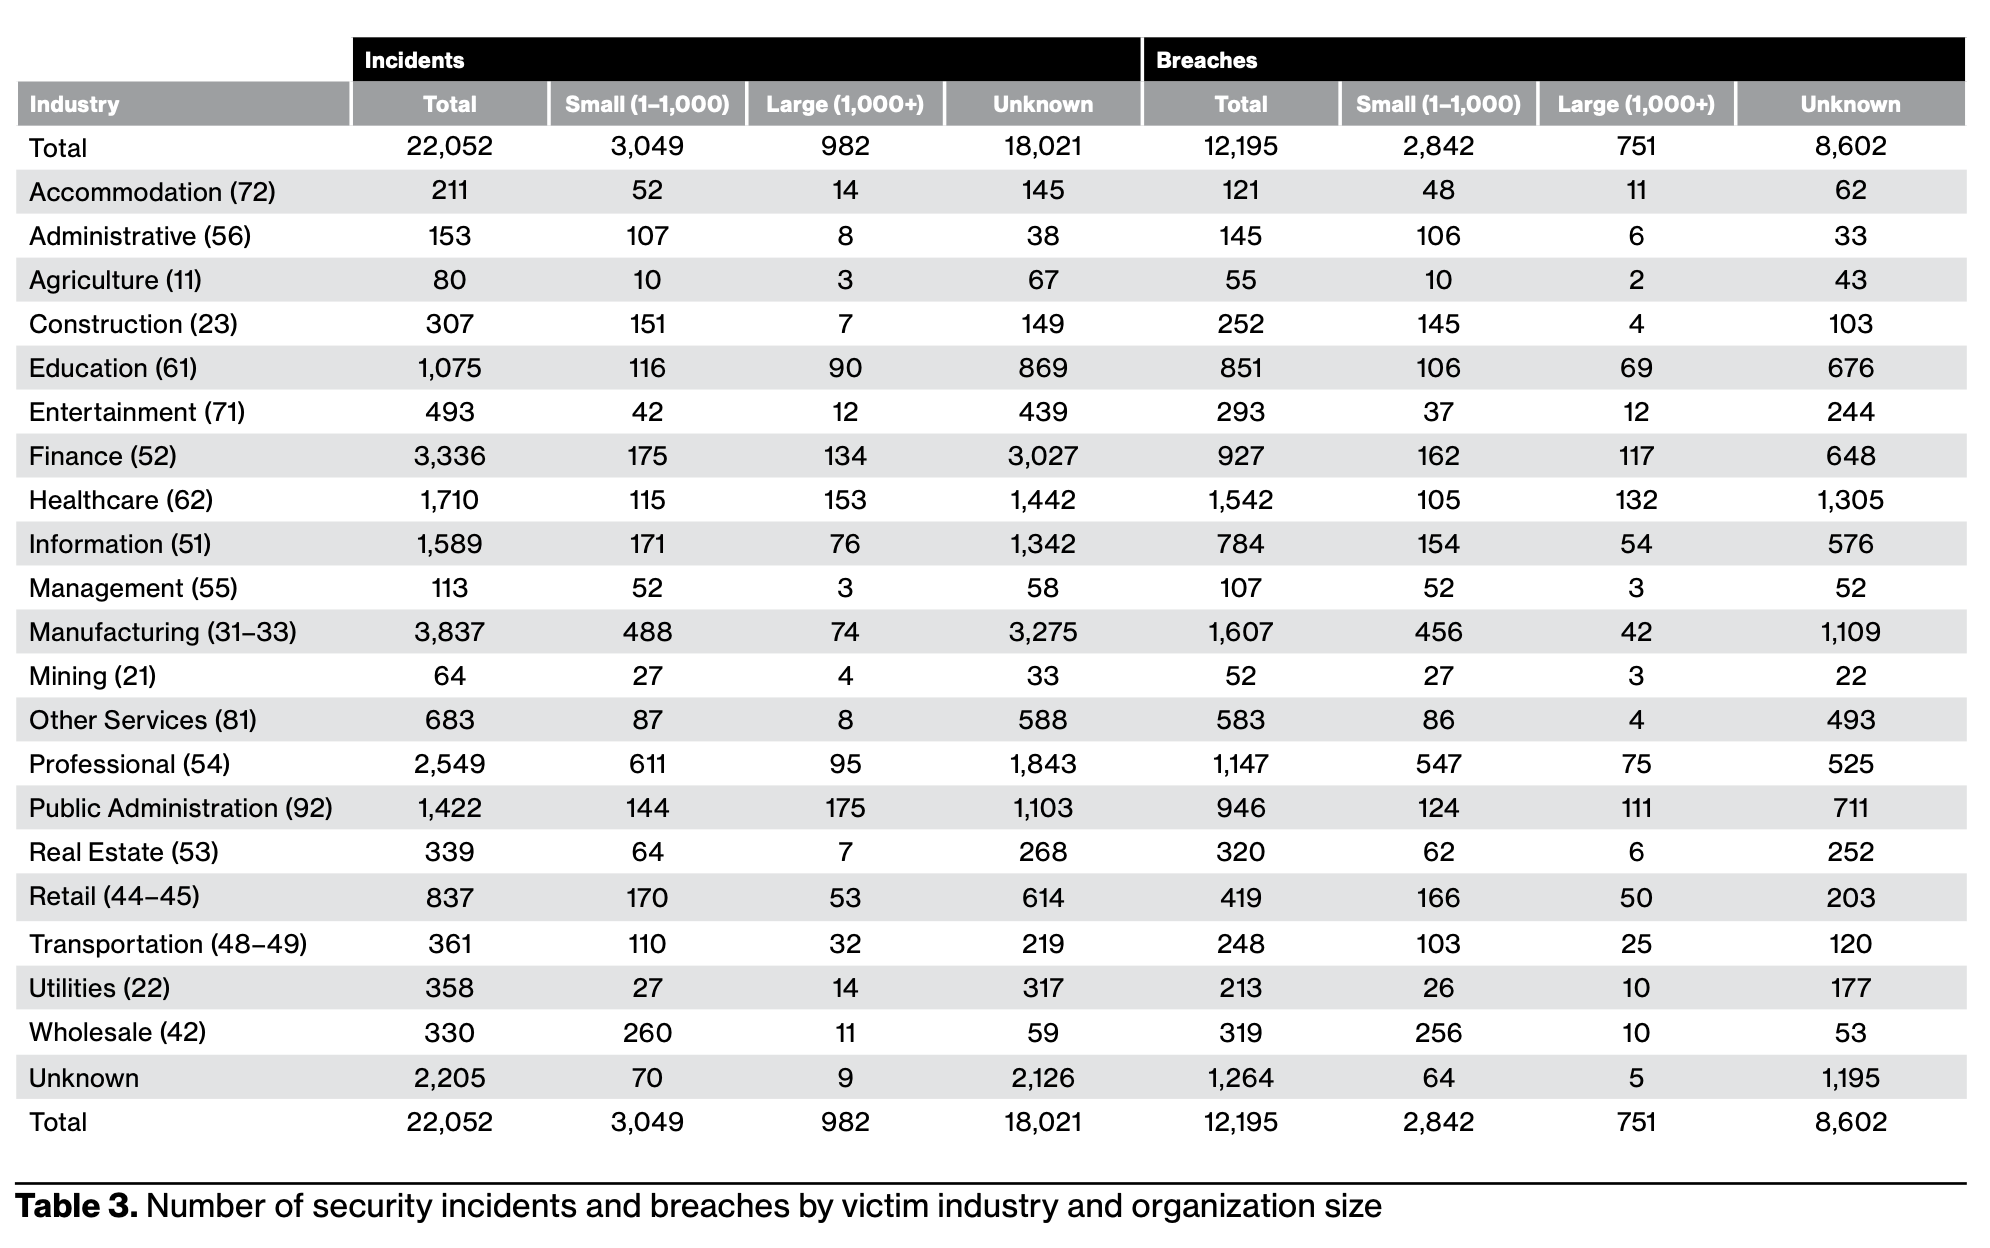
What I found myself doing for all of these stats is looking at the total number of incidents and then the total number of breaches for each respective point of focus. I’m struck by the efficacy of some incidents in regard to their ability to cause a material breach of data.
Look at Healthcare above. 1,542 out of 1,710 total incidents resulted in a breach. That’s an incredible success rate. Another, albeit smaller group, was Retail, with 439 breaches out of a total of 493 incidents. These are startling numbers.
Perhaps, like many of you, I have benefited from experience in more than one industry vertical. I found myself thinking back to the different companies I’ve worked for, thinking, “What would {XYZ company} have done?” as I read through each industry.
As I move on to my next point, please do not take my limited writings on the “Industries” section as a minimization of it’s importance. There’s another table on pp. 71-72 that spotlights actor motives, top attack patterns, and the types of data compromised.
Empathy for all those in security
Perhaps my most meaningful takeaway from this report, above all else, is how much more empathy and compassion I felt for my colleagues across various industries, namely those in the healthcare and education spaces.
Think about it: while healthcare rakes in an insane amount of money each year, I am not aware of any healthcare institution with cyber capabilities that rival other security-heavy industries, like international banks. Sure, some of the larger healthcare chains may have mature security departments, but how does that compare to smaller healthcare chains, single hospitals, or under-funded rural health providers?
If you’re a criminal that’s simply looking to make money, would you try to take down Goliath immediately, knowing the high amount of effort it may take, or would you strike at the target that’s less defended. It’s not rocket science. Threat actors will strike at whatever prey is available and the continued use of ransomware against healthcare providers is proof that many criminals do not care about the wellbeing of patients.
Similarly, educational institutions are quite likely to be extremely budget conscious while coming under increased fire from malicious actors. Security teams at colleges and universities around the world, with but a few exceptions, do not have tons of cash at their disposal to spend in the event of a material incident, especially a breach. A disruptive cyber incident may result in an increased security budget in the end, but that’s not to say that budget increases alone are enough to curtail the threat, let alone ease the burden of stress on security practitioners.
I’m walking away from the 2025 Verizon DBIR with a heavy heart. Not a defeated heart, mind you, just an increased awareness that other cyber defenders are encountering perilous situations on a constant basis. In an industry like security where stress is an unwanted yet omnipresent benefit of the job, we should take care to reach out and make sure everyone is okay.
Crap—I just dated myself, didn’t I.
Before you ask, yes, I did Google it first. And, yes, I did ask ChatGPT, which said, “While Fred R. Barnard popularized it in advertising, Arthur Brisbane may have been the first to express the idea in words. There is no confirmed ancient origin—especially not in Chinese literature.” Um…what?
In full transparency, I have no clue what CISOs are saying in the Republic of Mali.
Not really, though I like to imagine that they’d tell me this over beers if we were actually having beers because they seem pretty cool.
…you’re not thinking of me when you read that, right? RIGHT?!
Please excuse me as I experiment with footnotes for the first time. Thank you for your understanding.
Don’t take my word for it, though! Check it out yourself on p. 69
Says the guy who does not attend fancy parties which may or may not involve cake. Also, great. Now I’m hungry for cake.
Excellent resource for the general public on data breaches, plus how you can take action if you’re impacted as a consumer.
“I’ll take a giant ‘WTF’ for $1,000, please, Alex.”
Actually, I do, but my Mom said, “If you don’t have anything nice to say…”
Does the citing of specific pages help make me sound intelligent? Asking for a friend.
Excluding intentional or malicious actions taken by an insider, since the Verizon DBIR puts that into another classification, Privilege Misuse.
When reading this, no kidding, I thought of Panera’s kitchen sink cookie.
Yes, I just quoted almost an entire paragraph. And, yes, I have no idea what I’m doing.
I hyphenated a heading into the next line. Can I do that? Did it work? If not, don’t tell me. Just let me continue believing I am clever.
I did math voluntarily. This is going down as a big deal in my diary today.
Crap, I thought I knew everything…